Thermohaline Circulation#
In addition to wind, the other major factor controlling global ocean circulation is density. Density is a function of both temperature and salinity: an increase in temperature leads to a decrease in density while an increase in salinity leads to an increase in density. This relationship is referred to as the equation of state.
This page provides a brief overview of thermohaline circulation - water movements modulated by variations in density resulting from changes in ocean temperature and salinity. Contrary to wind-driven circulation, which primary drives horizontal flow that affects the upper mixed layer of the ocean, thermohaline circulation primarily refers to vertical flow and drives exchanges between the upper ocean and the deep. As the ocean is mostly stratified, vertical flow tends to be much slower (O(km/yr)) compared to horizontal motion (O(km/hr)).
Terminology#
Thermohaline circulation is also referred to as meridional overturning circulation. The “meridional” term refers to the north-south direction of flow while “overturning” indicates that water masses are moving in the vertical direction.
Temperature and Salinity in the Global Ocean#
To develop an understanding of thermohaline circulation, it’s helpful to visualize the vertical structure of temperature and salinity in the ocean.
The following plot shows a snapshot of temperature from the ECCO Version 4 State Estimate:
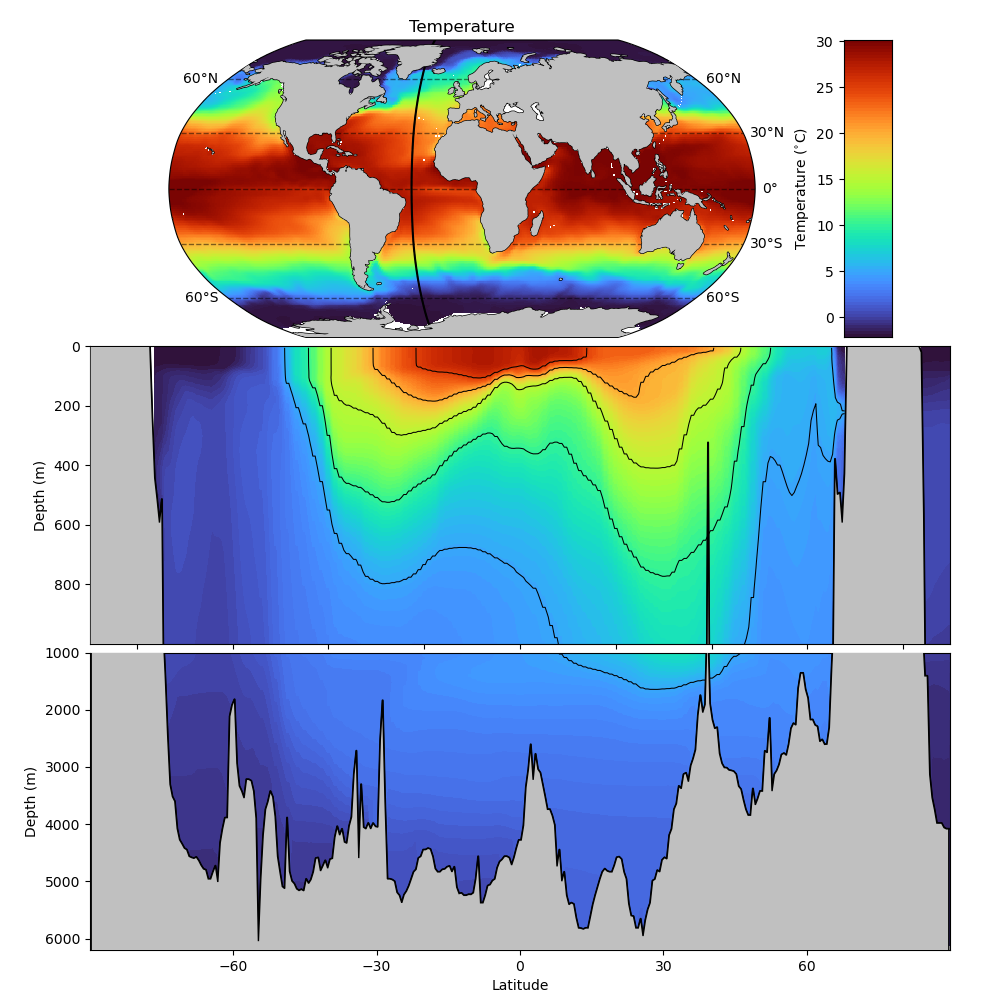
In the top panel of this figure, we see that horizontally, water tends to be warmer near the equator than at the poles. This temperature difference is somewhat expected and is largely the result of the relative differences in incident solar radiation at the equator relative to the poles.
In the lower two panels, we see the vertical structure of temperature along a latitudinal transect at a constant longitude of 31\(^{\circ}\)W. Here, we start to see the effect of temperature on stratification: in the region of the ocean between 60\(^{\circ}\)S and 60\(^{\circ}\)N, temperature is warmer at the surface and declines with depth. The thermoclines - the lines of constant temperature - are “pinched” at the equator relative to the center of the gyres around 30\(^{\circ}\)S and 30\(^{\circ}\)N due to wind-driven upwelling, but by-and-large, temperature controls the stratification. As we move toward the poles, we start to see something very different: temperature tends to be higher at the depth relative to the surface. Here is where the effect of salinity comes into play, so we’ll take a look at that next.
Similar to the previous plot, we also examine salinity on the same latitudinal transect:
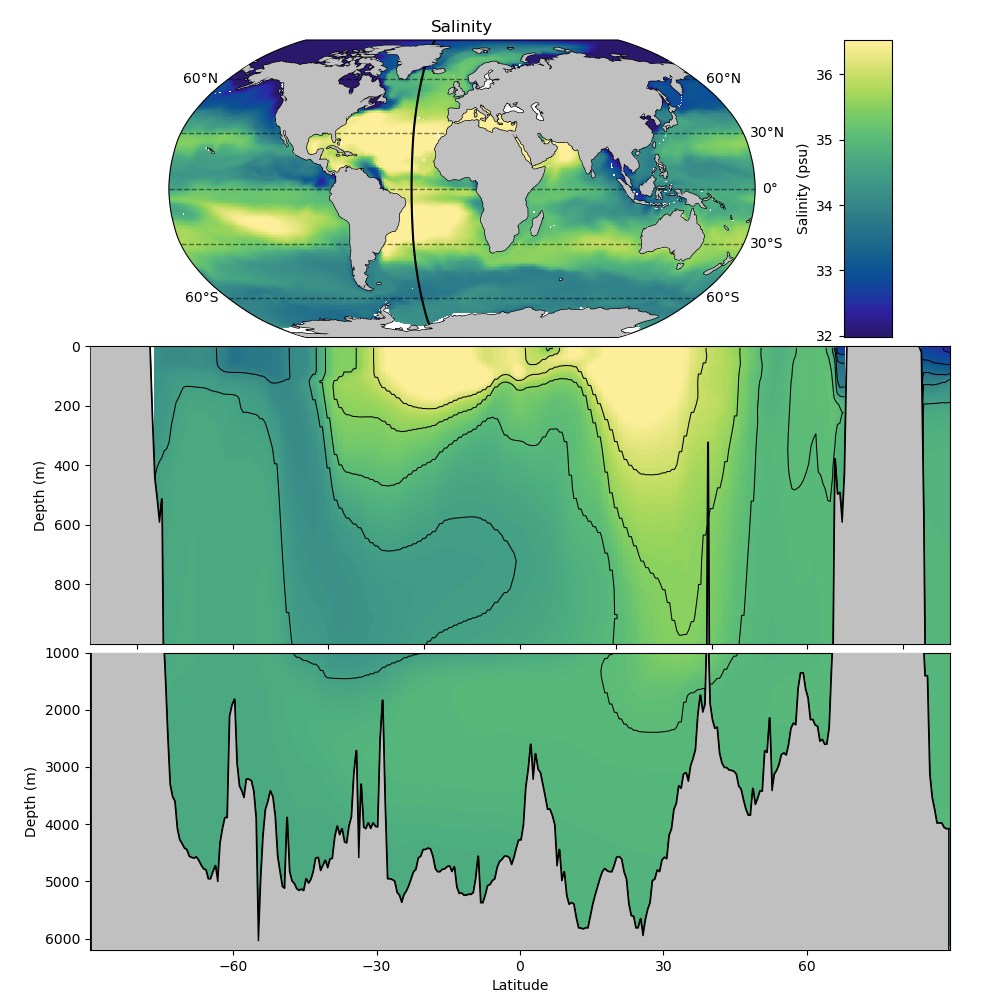
In the top panel of this figure, we see that horizontally, water tends to be saltier near the equator than at the poles - but not at the equator. Here, we see that water is slightly fresher than in the gyres around 30\(^{\circ}\)S and 30\(^{\circ}\)N. In the case, we see the effect of differing precipitation and evaporation regimes: at the equator where atmospheric upwelling and precipitation are prominent, water tends to be more fresh than in the center of the gyres 30\(^{\circ}\)S and 30\(^{\circ}\)N, which are atmospheric regions of downwelling and net evaporation.
In the vertical view, we see the vertical structure of salinity and how it contributes to stratification. In the region of the ocaean between 60\(^{\circ}\)S and 60\(^{\circ}\)N, the water tends to be saltier at the surface. While saliter water is denser than fresher water, the waters in this region are more controlled by temperature than salinity setting up this salinity regime. The situation is flipped near the poles: here we see that waters tend to be saltier at depth - a sign that salinity is controlling the density. This transition between temperature-modulated density and salinity modulated density is critical for controlling the vertical circulation of the ocean.
Factors Influencing Ocean Density#
As variations in temperature and salinity control vertical motion in the ocean, it’s helpful to overview some of the key processes modulating these parameters. As we saw in the previous chapter, wind-driven circulation drives boundary currents to and from the polar regions - and thus moves water masses between thermally-controlled and salinity-controlled regimes.
Warming and Cooling#
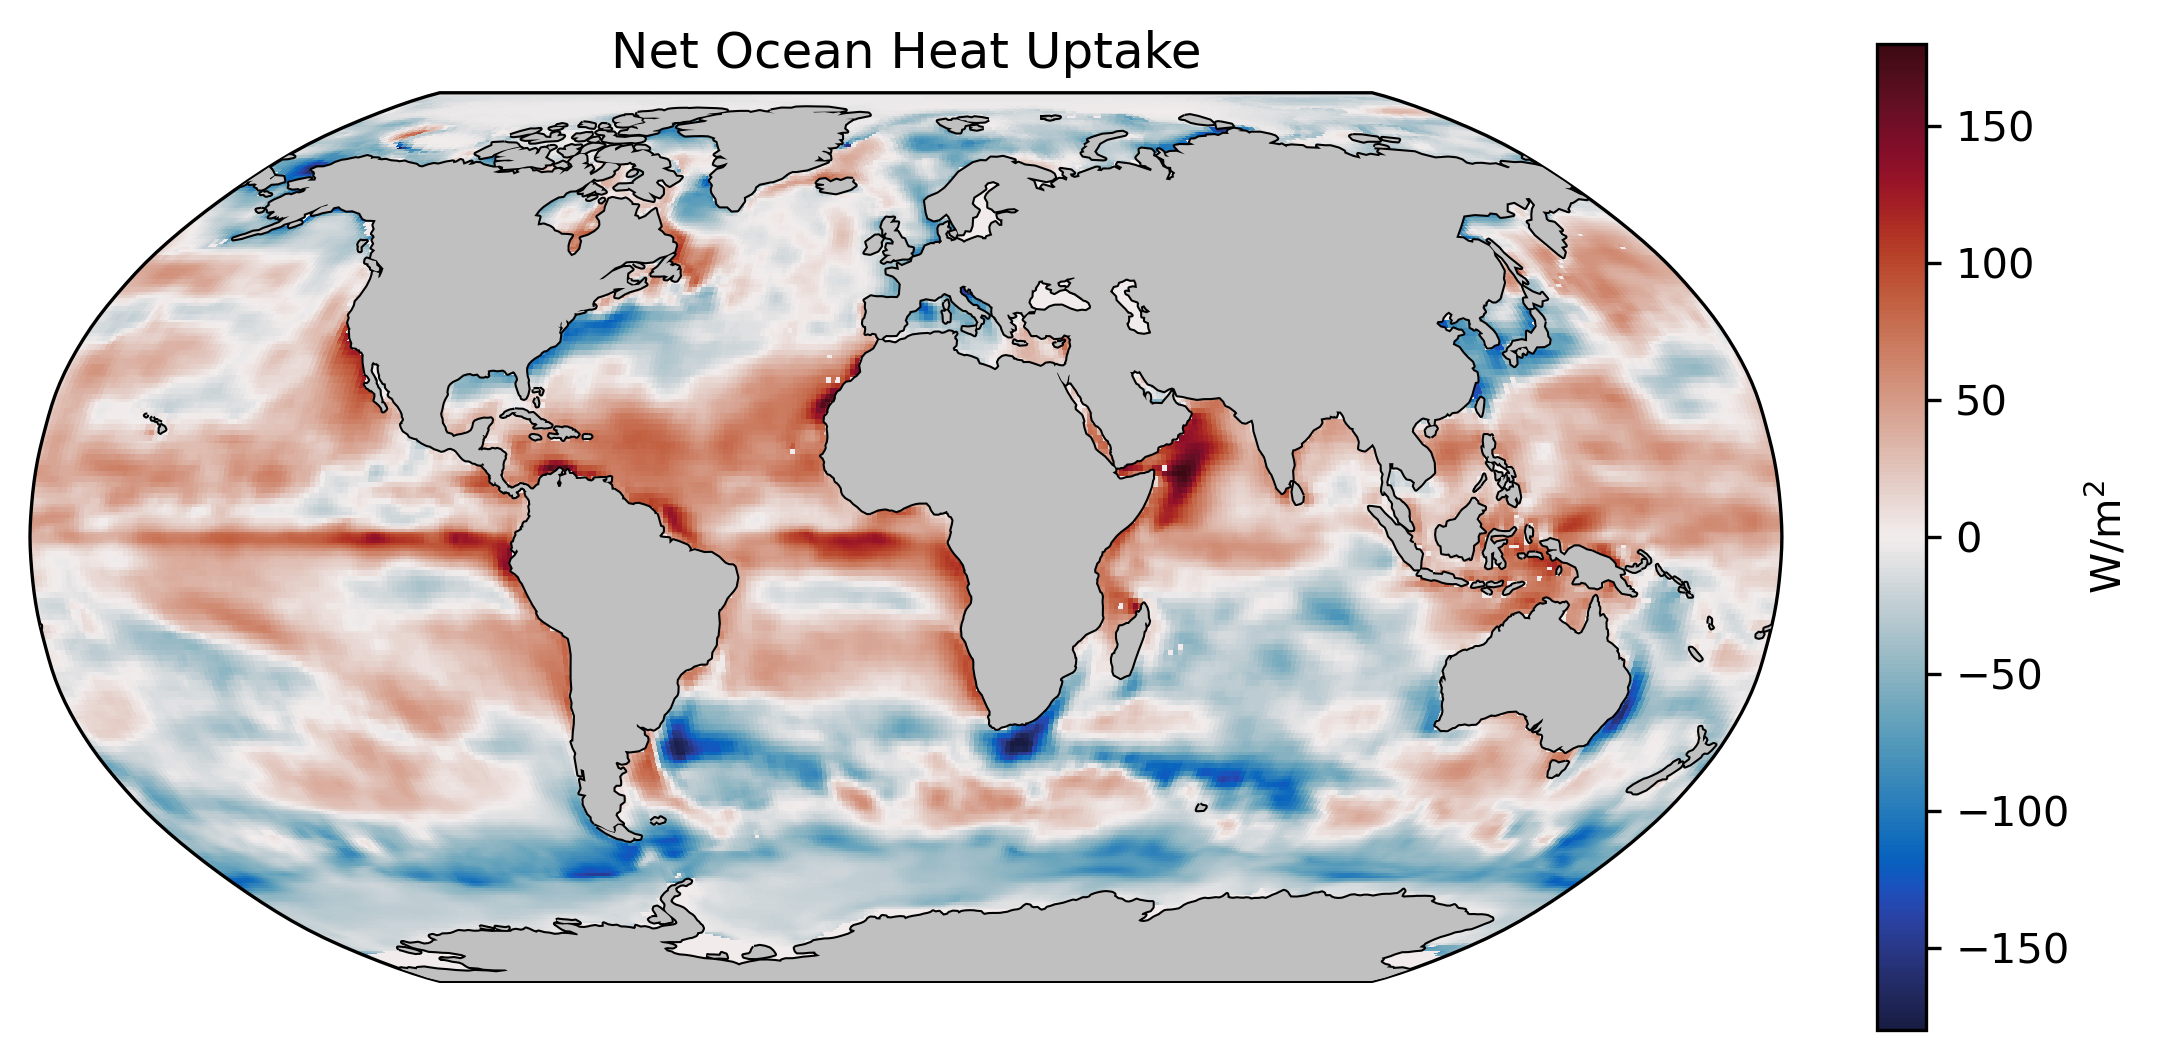
As water moves to the poles in western boundary currents and away from the poles in eastern boundary currents, it is exposed to different fluxes of incident solar radiation and therefore different heat fluxes in and out of the ocean in the form of sensible heat (heat that changes the temperature of the ocean). For thermohaline circulation, one of the key fluxes of heat out of the ocean and into the atmopshere occurs in the Gulf stream causing water to become cooler as it flows northward toward Iceland, the United Kingdom and northern Europe.
The following plot show the flux of heat into the ocean from the ECCO Version 4 estimate:
Evaporation, Precipitation, and Runoff#
In addition to variations in solar radiation, water masses are also exposed to different precipitation and evaporation regimes as they traverse latitudes. In addition, coastal water masses are also exposed to terrestrial runoff which includes major rivers as well as melt from the major ice sheets. The plot below shows mean fields of evaporation, precipitation, runoff, and the net addition of freshwater to the ocean over time.
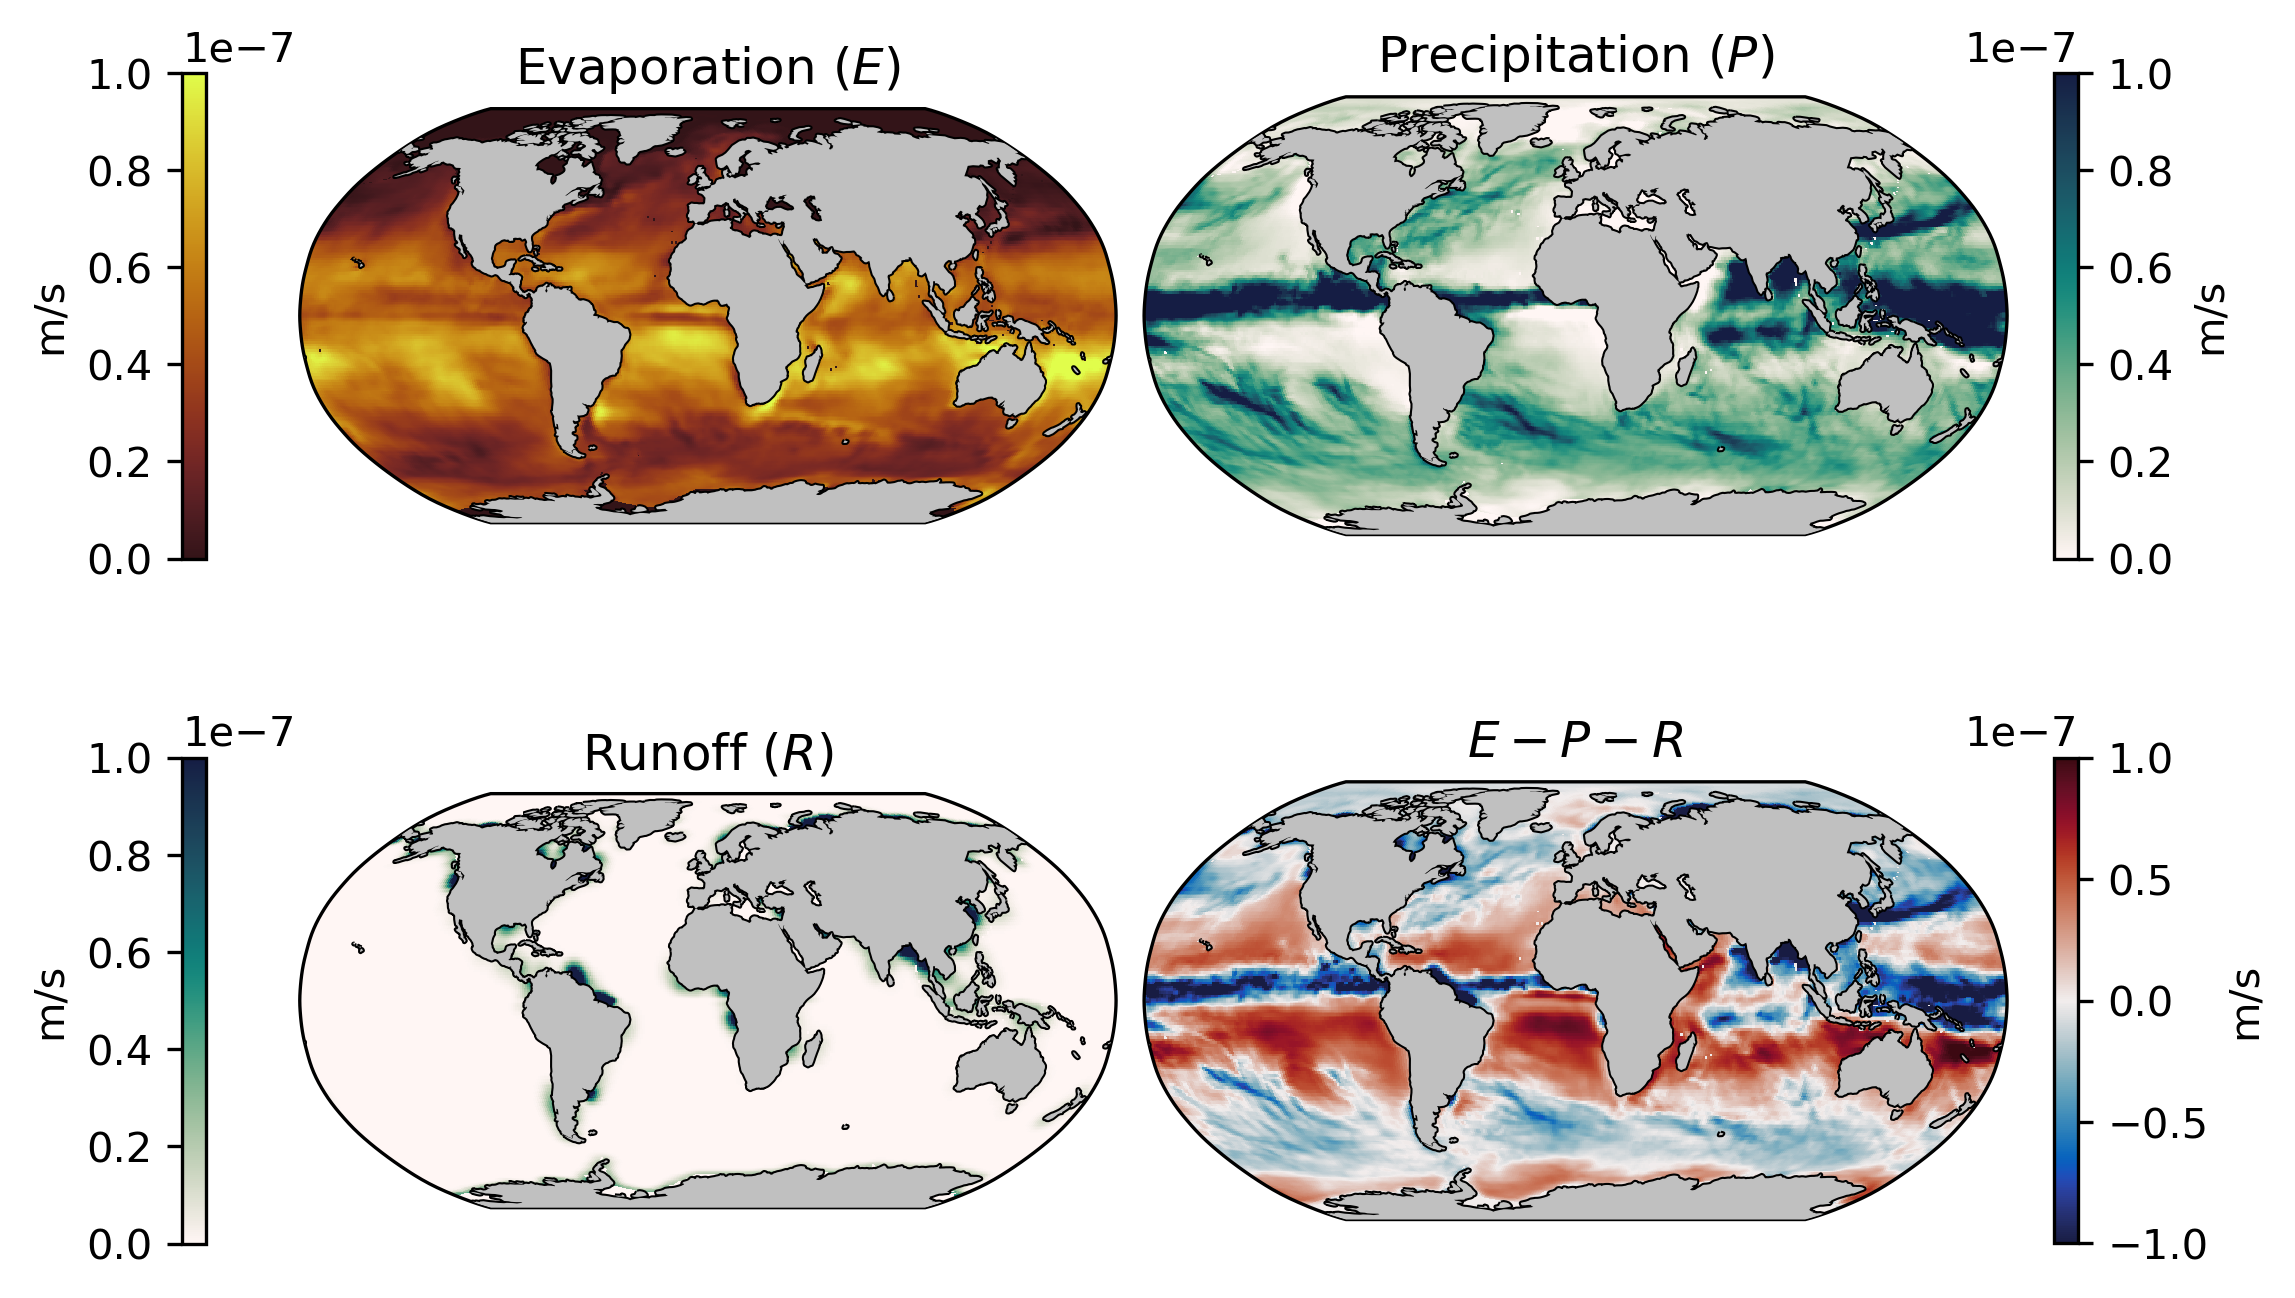
We can see from these plots, precipitation is prevalent around the equator and 60\(^{\circ}\) as a result of upwelling air masses. In contrast, evaporation is prevalent around 30\(^{\circ}\) - the approximate location of most boundary currents.
Sea Ice Formation#
Near the poles, air temperatures become so cold that the surface of the ocean freezes, forming sea ice. The following plot shows the locations of sea ice from the ECCO Version 4 state estimate:
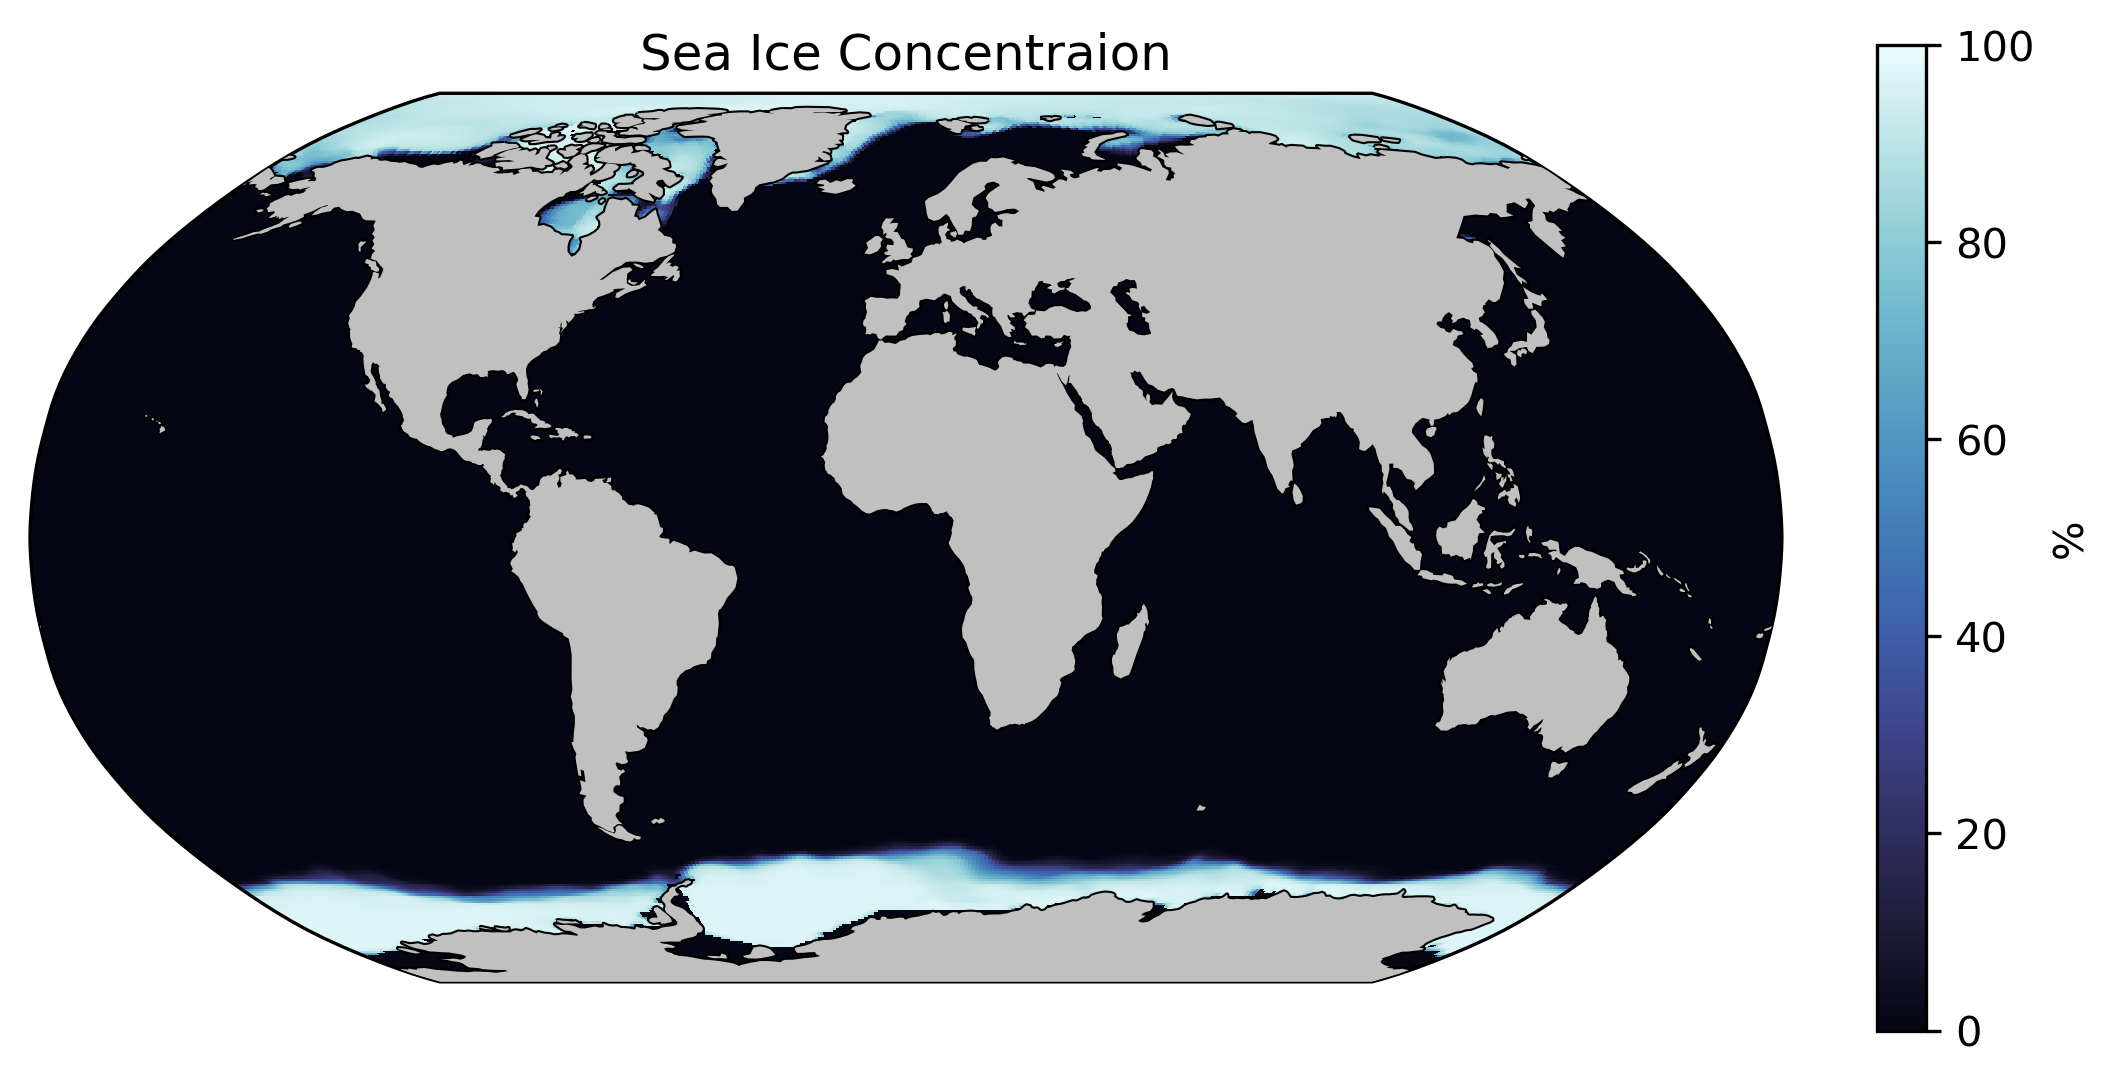
During the process of sea ice formation, salt that is dissolved in ocean water concentrates below the sea ice because the molecular structure of frozen water cannot hold nearly as much ice. This process, known as brine rejection, acts to increase the salinity of surface waters in the Arctic and Antarctic and represents a sink of freshwater from the ocean.