Pandas Dataframes#
Author: Mike Wood
Learning Objectives: By the end of this notebook, you should be able to:
Read data into a Pandas dataframe
Edit a dataframe with new columns
Subset a dataframe with query parameters
Plot data contained in a dataframe
The pandas package is a popular package in data science because it allows for convenient, dictionary-like access to labeled data. In this notebook, we will use a pandas dataframe - the key organizational structure introduced by this library - to investigate the S&P 500 Index.
Import the libraries for this notebook#
# import the pandas and matplotlib libraries
import pandas as pd
import matplotlib.pyplot as plt
import matplotlib.dates as mdates
Importing data into a dataframe#
The pandas library provides us with a convenient way to read in data from a csv using the read_csv function:
# define the file name
file_name = 'SP500_Index_Long.csv'

# read in the data to a dataframe
df = pd.read_csv(file_name)

# print the first 5 rows of the dataframe
df.head()
| Date | Index | |
|---|---|---|
| 0 | 1927-12-30 | 17.660000 |
| 1 | 1928-1-3 | 17.760000 |
| 2 | 1928-1-4 | 17.719999 |
| 3 | 1928-1-5 | 17.549999 |
| 4 | 1928-1-6 | 17.660000 |
Each column in a dataframe has a given type:
# check the types of the columns
df.dtypes
Date      object
Index    float64
dtype: object
As we can see above, variables types are automaticlly assigned to each column in the dataframe. We notice that the Date column was assigned a generic “object” type. However, we want to interpret these numbers as actual dates and pandas provides a conventient way to deal with this type of data in the form of “datetimes”. Let’s conver the Date column now:
# convert the dates to dates
df['Date'] = pd.to_datetime(df['Date'], format='%Y-%m-%d')
The Date column looks similar to above:
df.head()
| Date | Index | |
|---|---|---|
| 0 | 1927-12-30 | 17.660000 |
| 1 | 1928-01-03 | 17.760000 |
| 2 | 1928-01-04 | 17.719999 |
| 3 | 1928-01-05 | 17.549999 |
| 4 | 1928-01-06 | 17.660000 |
However, the types are different:
df.dtypes
Date     datetime64[ns]
Index           float64
dtype: object
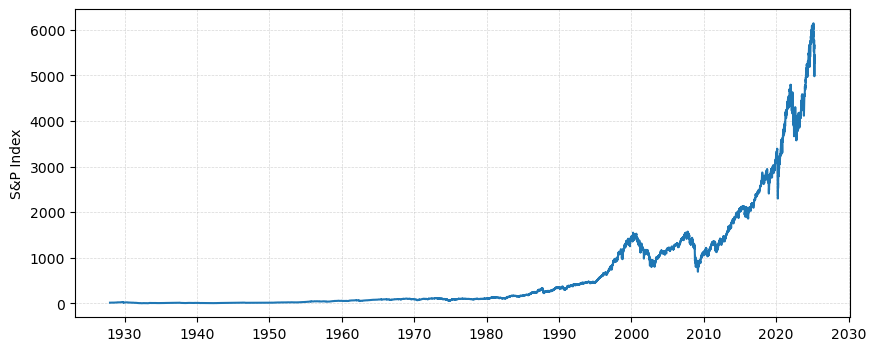
This datetime type is important because it allows us to plot the data - something which would be impossible with the dates stores as objects (strings). The following plot uses code introduced in the previous numpy notebook HERE but modified to use the variables in the dataframe:
# make a new figure object
fig = plt.figure(figsize = (10,4))

# plot the timeseries
plt.plot(df['Date'], df['Index'])

# add labels to the y axis
plt.ylabel('S&P Index')

# add gridlines
plt.grid(linestyle='--', linewidth=0.5, alpha=0.5)

# format the axis to only print every other year
plt.gca().xaxis.set_major_locator(mdates.YearLocator(10))

# show the plot
plt.show()
Adding a New Column to a Dataframe#
In the dataframe above, we have two columns - one for the date and one for the index. What if we wanted to add more information to our dataframe. For example, what if we wanted to compare the S&P 500 Index to the president in office at the time? Let’s add a new column in our dataframe for the president.
Add a new column is easy - it’s just like adding a new entry to a dictionary. Let’s add a new column for president and then fill it with the string “None” (we’ll update this in a second):
df['President'] = 'None'
The list of presidents in the U.S. during the time period that the S&P 500 has existed are as follows:
Inaguration Date |
President |
|---|---|
3/4/1925 |
Calvin Coolidge |
3/4/1929 |
Herbert Hoover |
3/4/1933 |
Franklin D. Roosevelt |
1/20/1937 |
Franklin D. Roosevelt |
1/20/1941 |
Franklin D. Roosevelt |
1/20/1945 |
Franklin D. Roosevelt |
4/12/1945 |
Harry S. Truman |
1/20/1949 |
Harry S. Truman |
1/20/1953 |
Dwight D. Eisenhower |
1/21/1957 |
Dwight D. Eisenhower |
1/20/1961 |
John F. Kennedy |
11/22/1963 |
Lyndon B. Johnson |
1/20/1965 |
Lyndon B. Johnson |
1/20/1969 |
Richard M. Nixon |
1/20/1973 |
Richard M. Nixon |
8/9/1974 |
Gerald R. Ford |
1/20/1977 |
Jimmy Carter |
1/20/1981 |
Ronald Reagan |
1/21/1985 |
Ronald Reagan |
1/20/1989 |
George H. W. Bush |
1/20/1993 |
Bill Clinton |
1/20/1997 |
Bill Clinton |
1/20/2001 |
George W. Bush |
1/20/2005 |
George W. Bush |
1/20/2009 |
Barack Obama |
1/21/2013 |
Barack Obama |
1/20/2017 |
Donald Trump |
1/20/2021 |
Joe Biden |
1/20/2025 |
Donald Trump |
We can add all of these dates to big dictionary as follows:
term_dates = {(pd.Timestamp("1925-03-04"),pd.Timestamp("1929-03-03")):'Calvin Coolidge 1',
              (pd.Timestamp("1929-03-04"),pd.Timestamp("1933-03-03")):'Herbert Hoover 1',
              (pd.Timestamp("1933-03-04"),pd.Timestamp("1937-01-19")):'Franklin Roosevelt 1',
              (pd.Timestamp("1937-01-20"),pd.Timestamp("1941-01-19")):'Franklin Roosevelt 2',
              (pd.Timestamp("1941-01-20"),pd.Timestamp("1945-01-19")):'Franklin Roosevelt 3',
              (pd.Timestamp("1945-01-20"),pd.Timestamp("1945-04-11")):'Franklin Roosevelt 4',
              (pd.Timestamp("1945-04-12"),pd.Timestamp("1949-01-19")):'Harry Truman 1',
              (pd.Timestamp("1949-01-20"),pd.Timestamp("1953-01-19")):'Harry Truman 2',
              (pd.Timestamp("1953-01-20"),pd.Timestamp("1957-01-20")):'Dwight Eisenhower 1',
              (pd.Timestamp("1957-01-20"),pd.Timestamp("1961-01-19")):'Dwight Eisenhower 2',
              (pd.Timestamp("1961-01-20"),pd.Timestamp("1963-11-21")):'John Kennedy 1',
              (pd.Timestamp("1963-11-22"),pd.Timestamp("1965-01-19")):'Lyndon Johnson 1',
              (pd.Timestamp("1965-01-20"),pd.Timestamp("1969-01-19")):'Lyndon Johnson 2',
              (pd.Timestamp("1969-01-20"),pd.Timestamp("1973-01-19")):'Richard Nixon 1',
              (pd.Timestamp("1973-01-20"),pd.Timestamp("1974-08-18")):'Richard Nixon 2',
              (pd.Timestamp("1974-08-09"),pd.Timestamp("1977-01-19")):'Gerald Ford 1',
              (pd.Timestamp("1977-01-20"),pd.Timestamp("1981-01-19")):'Jimmy Carter 1',
              (pd.Timestamp("1981-01-20"),pd.Timestamp("1985-01-20")):'Ronald Reagan 1',
              (pd.Timestamp("1985-01-21"),pd.Timestamp("1989-01-19")):'Ronald Reagan 2',
              (pd.Timestamp("1989-01-20"),pd.Timestamp("1993-01-19")):'George H. W. Bush 1',
              (pd.Timestamp("1993-01-20"),pd.Timestamp("1997-01-19")):'Bill Clinton 1',
              (pd.Timestamp("1997-01-20"),pd.Timestamp("2001-01-19")):'Bill Clinton 2',
              (pd.Timestamp("2001-01-20"),pd.Timestamp("2005-01-19")):'George W. Bush 1',
              (pd.Timestamp("2005-01-20"),pd.Timestamp("2009-01-19")):'George W. Bush 2',
              (pd.Timestamp("2009-01-20"),pd.Timestamp("2013-01-20")):'Barack Obama 1',
              (pd.Timestamp("2013-01-21"),pd.Timestamp("2017-01-19")):'Barack Obama 2',
              (pd.Timestamp("2017-01-20"),pd.Timestamp("2021-01-19")):'Donald Trump 1',
              (pd.Timestamp("2021-01-20"),pd.Timestamp("2025-01-19")):'Joe Biden 1',
              (pd.Timestamp("2025-01-20"),pd.Timestamp("2029-01-19")):'Donald Trump 2'}
Now, to update our ‘President’ column, we can write a little loop through each of the entries in our dictionary. In each case, we will use the .loc method to identify and assign the correct locations of our data frame
# loop through each term
for term_range in term_dates:

    # determine the indices of the date column corresponding to these ranges
    start_date = df['Date']>=term_range[0]
    end_date = df['Date']<term_range[1]

    # update the President column with the president during these dates
    df.loc[(start_date&end_date), 'President'] = term_dates[term_range]
We can double check our dataframe by looking at the head and the tail:
df.tail()
| Date | Index | President | |
|---|---|---|---|
| 24435 | 2025-04-10 | 5268.05 | Donald Trump 2 |
| 24436 | 2025-04-11 | 5363.36 | Donald Trump 2 |
| 24437 | 2025-04-14 | 5405.97 | Donald Trump 2 |
| 24438 | 2025-04-15 | 5396.63 | Donald Trump 2 |
| 24439 | 2025-04-16 | 5275.70 | Donald Trump 2 |
df.head()
| Date | Index | President | |
|---|---|---|---|
| 0 | 1927-12-30 | 17.660000 | Calvin Coolidge 1 |
| 1 | 1928-01-03 | 17.760000 | Calvin Coolidge 1 |
| 2 | 1928-01-04 | 17.719999 | Calvin Coolidge 1 |
| 3 | 1928-01-05 | 17.549999 | Calvin Coolidge 1 |
| 4 | 1928-01-06 | 17.660000 | Calvin Coolidge 1 |
Computing Subsets#
A subset of a dataframe can be computed using similar indexing defined above and passed in directly to the dataframe. For example, if we wanted to get a dataframe corresponding to Obama’s first term, we could write
df_obama = df[df['President']=='Barack Obama 1']
df_obama.head()
| Date | Index | President | |
|---|---|---|---|
| 20352 | 2009-01-20 | 849.640015 | Barack Obama 1 |
| 20353 | 2009-01-21 | 841.719971 | Barack Obama 1 |
| 20354 | 2009-01-22 | 839.739990 | Barack Obama 1 |
| 20355 | 2009-01-23 | 838.609985 | Barack Obama 1 |
| 20356 | 2009-01-26 | 852.530029 | Barack Obama 1 |
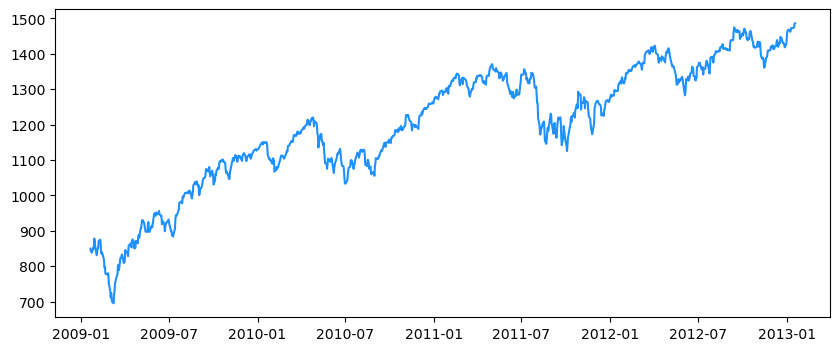
Let’s make a qucik plot of this data to ensure it’s for the dates expected:
fig = plt.figure(figsize=(10,4))
plt.plot(df_obama['Date'], df_obama['Index'], color='dodgerblue')
plt.show()
Assigning Labels#
In addition to the column for presidents above, we may also be interested in their political party. The following dictionary links each president with their political party:
parties = {'Calvin Coolidge':'Republican',
           'Herbert Hoover':'Republican',
           'Franklin Roosevelt':'Democrat',
           'Harry Truman':'Democrat',
           'Dwight Eisenhower':'Republican',
           'John Kennedy':'Democrat',
           'Lyndon Johnson':'Democrat',
           'Richard Nixon':'Republican',
           'Gerald Ford':'Republican',
           'Jimmy Carter':'Democrat',
           'Ronald Reagan':'Republican',
           'George H. W. Bush':'Republican',
           'Bill Clinton':'Democrat',
           'George W. Bush':'Republican',
           'Barack Obama':'Democrat',
           'Donald Trump':'Republican',
           'Joe Biden':'Democrat'}
presidents = list(parties.keys())
We can generate a new column in our dataframe which lists the part in power for each day:
df['Party'] = 'None'
# loop through each president and assign party keys in the dataframe
for president in presidents:
    df.loc[df['President'].str.contains(president), 'Party'] = parties[president]
df.head()
| Date | Index | President | Party | |
|---|---|---|---|---|
| 0 | 1927-12-30 | 17.660000 | Calvin Coolidge 1 | Republican |
| 1 | 1928-01-03 | 17.760000 | Calvin Coolidge 1 | Republican |
| 2 | 1928-01-04 | 17.719999 | Calvin Coolidge 1 | Republican |
| 3 | 1928-01-05 | 17.549999 | Calvin Coolidge 1 | Republican |
| 4 | 1928-01-06 | 17.660000 | Calvin Coolidge 1 | Republican |
df.tail()
| Date | Index | President | Party | |
|---|---|---|---|---|
| 24435 | 2025-04-10 | 5268.05 | Donald Trump 2 | Republican |
| 24436 | 2025-04-11 | 5363.36 | Donald Trump 2 | Republican |
| 24437 | 2025-04-14 | 5405.97 | Donald Trump 2 | Republican |
| 24438 | 2025-04-15 | 5396.63 | Donald Trump 2 | Republican |
| 24439 | 2025-04-16 | 5275.70 | Donald Trump 2 | Republican |
Using the assignment above, we can identify components of the S&P 500 index time series that correspond to each part:
fig = plt.figure(figsize=(10,4))

for president in presidents:
    for term in [1, 2, 3, 4]:
        df_sub = df[df['President']==president+' '+str(term)]

        if len(df_sub)>0:
            if df_sub['Party'].iloc[0]=='Republican':
                color = 'firebrick'
            if df_sub['Party'].iloc[0]=='Democrat':
                color = 'dodgerblue'
            plt.plot(df_sub['Date'],df_sub['Index'], color=color)

plt.grid(linestyle='--', linewidth=0.5, alpha=0.5)
plt.ylabel('S&P 500 Index')
plt.show()
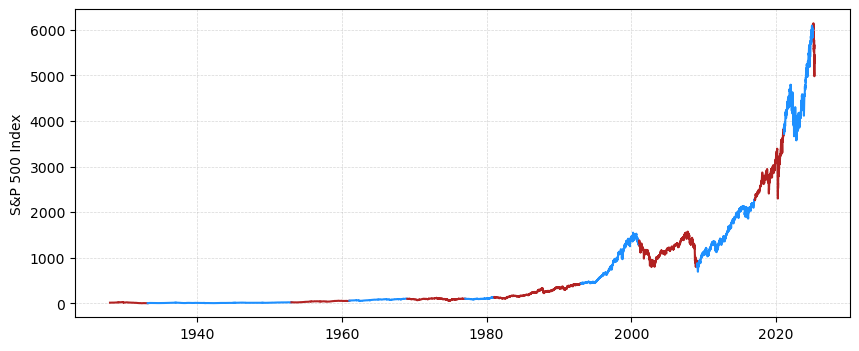
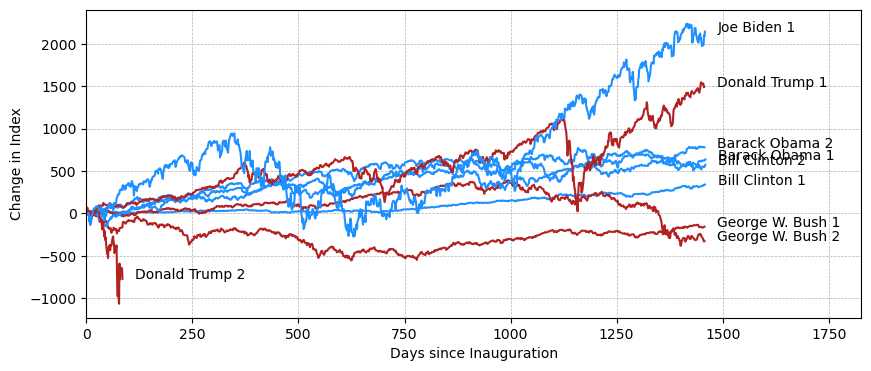
It’s a little hard to see in this plot how much the market grew or shrank. Let’s make the plot reflect the days since teh start of the term:
presidents = ['Bill Clinton 1','Bill Clinton 2',
              'George W. Bush 1', 'George W. Bush 2',
              'Barack Obama 1', 'Barack Obama 2',
              'Donald Trump 1', 'Donald Trump 2', 'Joe Biden 1']

fig = plt.figure(figsize=(10,4))

for president in presidents:
    df_sub = df[df['President']==president]
    if df_sub['Party'].iloc[0]=='Republican':
        color = 'firebrick'
    if df_sub['Party'].iloc[0]=='Democrat':
        color = 'dodgerblue'

    # create time and date variables with the first
    # value removed
    days_in_term = df_sub['Date']-df_sub['Date'].iloc[0]
    index_change = df_sub['Index']-df_sub['Index'].iloc[0]

    # convert the time to days
    days_in_term = days_in_term.dt.days

    # plto the line
    plt.plot(days_in_term, index_change, color=color)

    # add a label to the end
    plt.text(days_in_term.iloc[-1]+30, index_change.iloc[-1], president)

# format the axes
plt.grid(linewidth=0.5, linestyle='--')
plt.xlim([0, 365*5+2])

plt.xlabel('Days since Inauguration')
plt.ylabel('Change in Index')
plt.show()
🤔 Mini-Exercise#
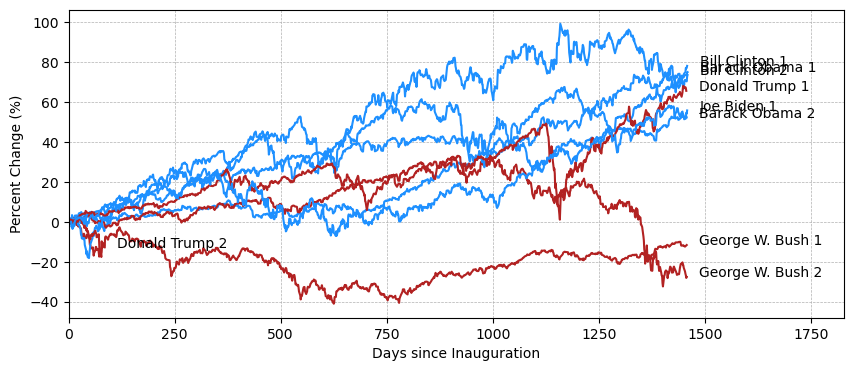
Revise the plot above to compare the percentage increase in the index growth since the start of the administration.
fig = plt.figure(figsize=(10,4))

for president in presidents:

    # make a subset data frame
    df_sub = df[df['President']==president]
    if df_sub['Party'].iloc[0]=='Republican':
        color = 'firebrick'
    if df_sub['Party'].iloc[0]=='Democrat':
        color = 'dodgerblue'

    # create time and date variables with the first
    # value removed
    days_in_term = df_sub['Date']-df_sub['Date'].iloc[0]
    index_change = df_sub['Index']-df_sub['Index'].iloc[0]

    # convert the time to days
    days_in_term = days_in_term.dt.days

    # create a variable for the percent change
    percent_change = 100*index_change/df_sub['Index'].iloc[0]

    # plot the line and add a label
    plt.plot(days_in_term, percent_change, color=color)
    plt.text(days_in_term.iloc[-1]+30, percent_change.iloc[-1], president)

# format the axes
plt.grid(linewidth=0.5, linestyle='--')
plt.xlim([0, 365*5+2])
plt.xlabel('Days since Inauguration')
plt.ylabel('Percent Change (%)')
plt.show()