Overview
The Landsat program began in 1972 with the launch of Landsat 1 and has continued uninterrupted until present day. Landsat satellites are developed and launched by NASA but their data is managed by the U.S. Geological Survey (USGS).
As of 2026, there are two operational Landsat satellites in orbit - Landsat 8 and 9. However, all data from previous Landsat satellites is freely available online. Lab 2 provides an overview of how to find and download a Landsat scene from the USGS EarthExplorer portal.
The following timeline outlines the approximate time intervals over which the Landsat satellites are in orbit.
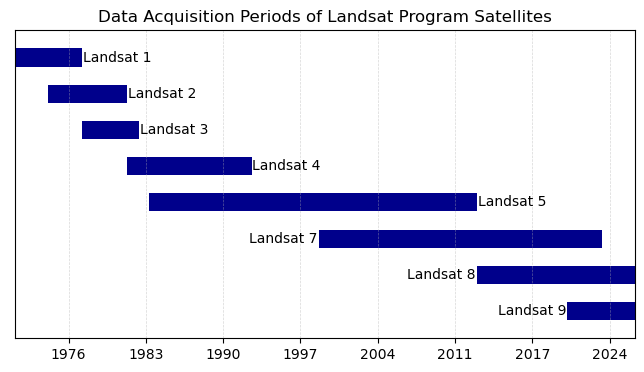
Each of these satellites is discussed below.
Landsat 1-3
Landsat 1, 2, and 3 were launched in 1972, 1975, and 1978 and established the foundation of the Landsat program. These satellites carried Return Beam Vidicon (RBV) cameras and Multispectral Scanner (MSS) instruments that recorded reflected light in several wavelength bands. The RBV cameras were designed similar to television cameras and were originally intended to be the primary instrument on the satellite. The MSS was added as a secondary instrument but proved to be very useful for a range of scientific purposes. It has two reflective bands (red and green) which each yield data with a resolution of approximately 80 m.
The MSS was developed by Virginia Norwood who has been called the “Mother of Landsat” for her pioneering work. You can read more about Virginia Norwood on the NASA site HERE.
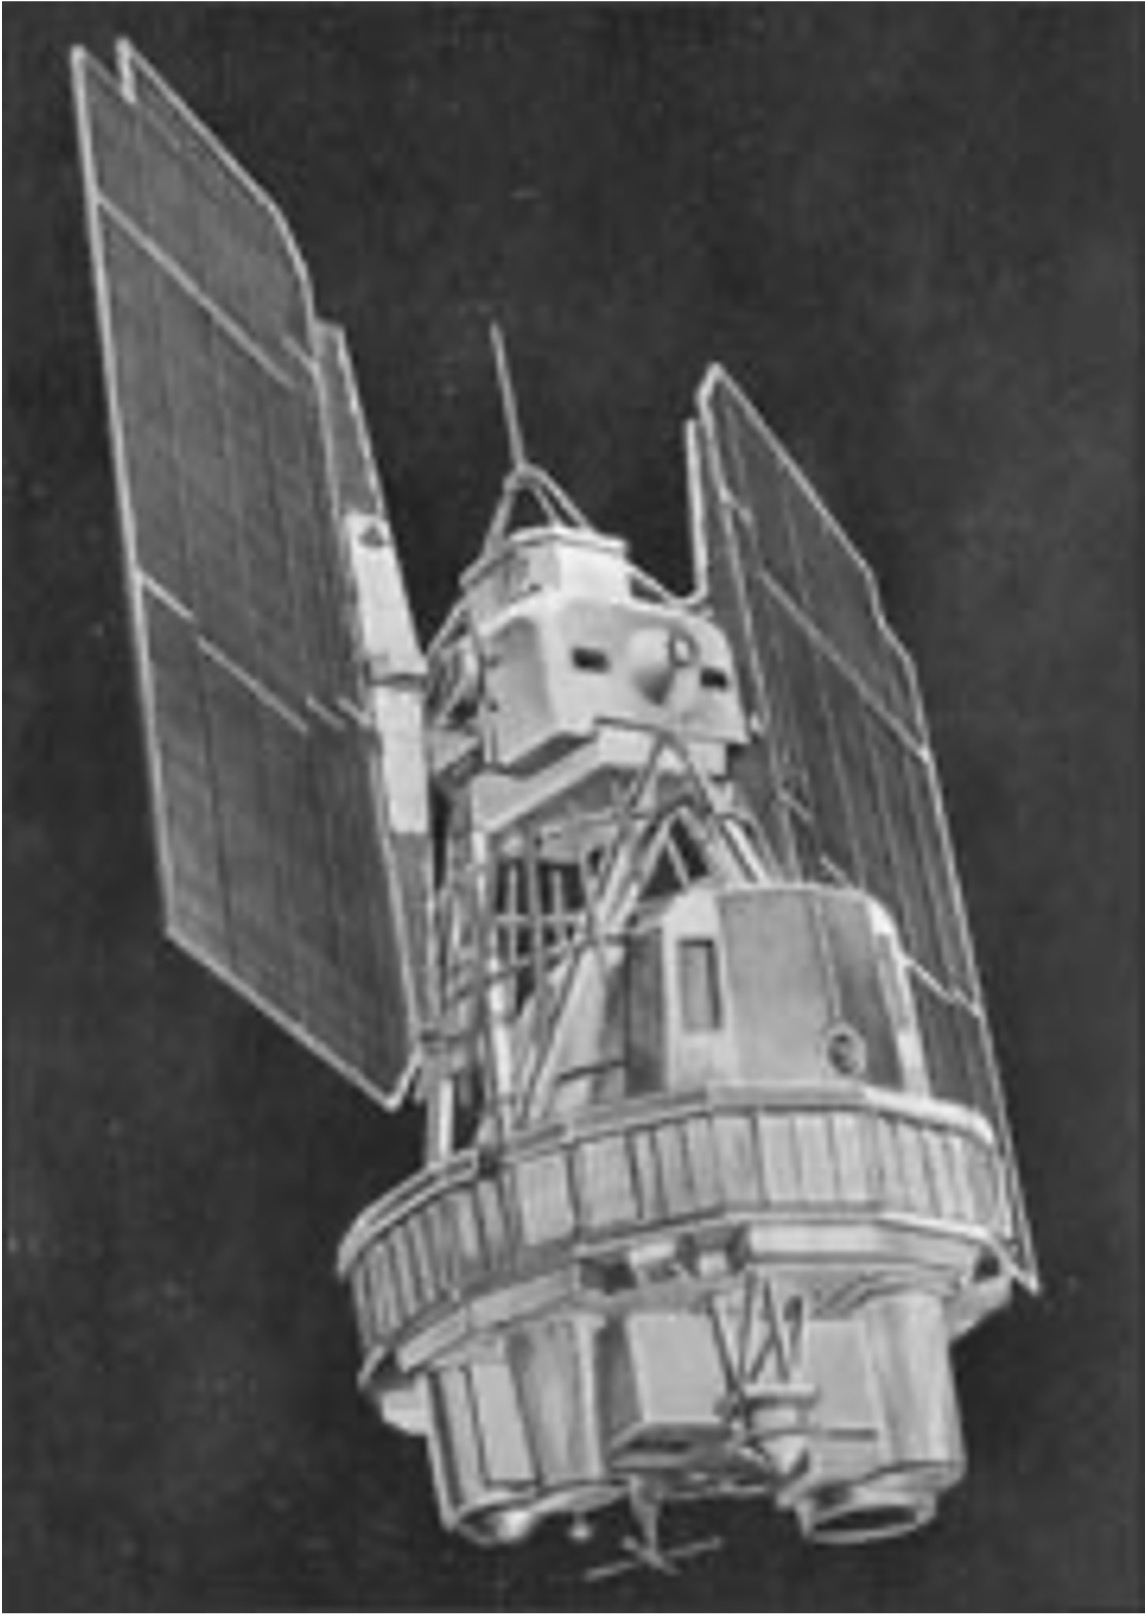
Figure 1:Artist depiction of the Landsat 1 satellite, image from NASA.
Landsat 4-5
Landsat 4 and 5, launched in 1982 and 1984, introduced the more advanced Thematic Mapper instrument which was designed to replace the RBV. It collected data in additional spectral bands, adding blue and a few bands in the infrared. This instrument produced multispectral images at a 30 m resolution, allowing for finer identification of surface features. Landsat 4 and 5 were identical satellites built at the same time but launched at different times.
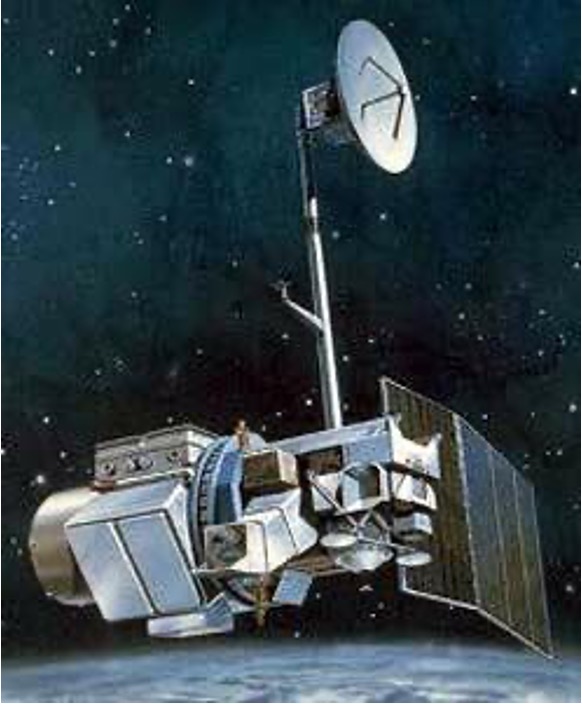
Figure 2:Artist depiction of the Landsat 4 satellite, image from NASA.
Landsat 7
Launched in 1999, Landsat 7 carried the Enhanced Thematic Mapper Plus instrument, which was yet another improvement over the TM on Landsat 4 and 5. Landsat 7 also added a 15 m resolution panchromatic band and improved thermal imaging, in addition to continuing the 30 m multispectral record started by the previous satellites. In 2003, a mechanical component called the Scan Line Corrector (SLC) failed, leaving linear gaps in images after this date. Despite this problem, most of each Landsat 7 scene remained usable, and Landsat 7 continued to contribute valuable observations to the mission’s long-term archive.
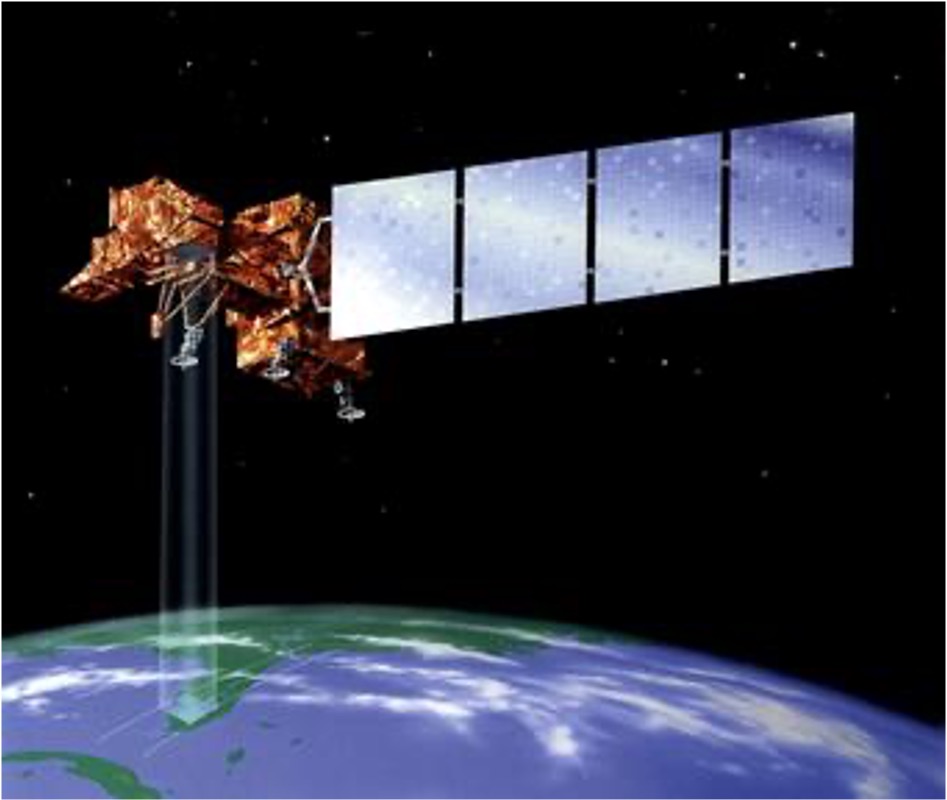
Figure 3:Artist depiction of the Landsat 7 satellite, image from NASA.
Landsat 8-9
Landsat 8 and 9 were launched in 2013 and 2021, respectively, and represent a major improvement in image quality, sensitivity, and data collection. Each carries an Operational Land Imager (OLI, yet another improvement over the ETM+) and a Thermal Infrared Sensor (TIRS), which measure visible, infrared, and thermal energy. Two satellites sharre the same orbital track and operating together, they can observe the same location every eight days.

Figure 4:Artist depiction of the Landsat 8 satellite, image from NASA.
Landsat Optical Reflectance Bands
Landsat 4-5 Bands
The Landsat 4 and 5 Thematic Mapper collected optical data in the following spectral bands:
| Band Number | Band Name | Wavelength Range | Resolution |
|---|---|---|---|
| 1 | Blue | 0.45 - 0.52 m | 30 m |
| 2 | Green | 0.52 - 0.60 m | 30 m |
| 3 | Red | 0.63 - 0.69 m | 30 m |
| 4 | Near-Infrared | 0.76 - 0.90 m | 30 m |
| 5 | Shortwave Infrared (SWIR) 1 | 1.55 - 1.75 m | 30 m |
| 7 | Shortwave Infrared (SWIR) 2 | 2.08 - 2.35 m | 30 m |
Similar to the progress pride flag image shown on the previous page, Landsat 4 and 5 scenes are distributed as 8-bit images which assigns each pixel a brightness value in range 0-255.
Landsat 7 Bands
The Landsat 7 Enhanced Thematic Mapper Plus instrument colleced optical data in the following spectral bands:
| Band Number | Band Name | Wavelength Range | Resolution |
|---|---|---|---|
| 1 | Blue | 0.45 - 0.52 m | 30 m |
| 2 | Green | 0.52 - 0.60 m | 30 m |
| 3 | Red | 0.63 - 0.69 m | 30 m |
| 4 | Near-Infrared | 0.77 - 0.90 m | 30 m |
| 5 | Shortwave Infrared (SWIR) 1 | 1.55 - 1.75 m | 30 m |
| 7 | Shortwave Infrared (SWIR) 2 | 2.09 - 2.35 m | 30 m |
| 8 | Panchromatic | 0.52 - 0.90 m | 15 m |
Landsat 7 scenes are also distributed as 8-bit images.
Landsat 8 and 9 Bands
The Landsat 8 and 9 Operational Land Imager collects optical data in the following spectral bands:
| Band Number | Band Name | Wavelength Range | Resolution |
|---|---|---|---|
| 1 | Coastal Aerosol | 0.43 - 0.45 m | 30 m |
| 2 | Blue | 0.45 - 0.51 m | 30 m |
| 3 | Green | 0.53 - 0.59 m | 30 m |
| 4 | Red | 0.64 - 0.67 m | 30 m |
| 5 | Near-Infrared | 0.85 - 0.88 m | 30 m |
| 6 | Shortwave Infrared (SWIR) 1 | 1.57 - 1.65 m | 30 m |
| 7 | Shortwave Infrared (SWIR) 2 | 2.11 - 2.29 m | 30 m |
| 8 | Panchromatic | 0.50 - 0.68 m | 15 m |
| 9 | Cirrus | 1.36 - 1.38 m | 30 m |
Unlike the 8-bit images of the previous satellites, Landsat 8 and 9 imagery is stored as 16-bit images, with pixel values in range 0-65535. However, it should be noted that these values are scaled up from 12-bit images for Landsat 8 and 14-bit images for Landsat 9.